

But it’s much better in some states than others.
In 2024-25, 90% of public hospital emergency department presentations were completed within 11 hours and 16 minutes, an increase of three hours and 16 minutes since 2020–21, when 90% of visits were completed within eight hours.
The AIHW has released updated data on public and private hospital ED care (2024-25) and elective surgery waiting times (2024-25).
Just over half (53%) of people presenting at an ED were out the door within four hours, down from 55% the previous year and 67% in 2020-21.
Of these, 42% were triaged as urgent, 34% semi-urgent and 18% emergency.
Half were seen within 18 minutes – the same as last year, which is an improvement on the 20 minutes recorded since 2021.
And 90% were seen within one hour and 58 minutes – just a minute’s improvement on last year, but better than the two hours and four minutes in 2022-23.
There were 9.1 million ED presentations this last financial year (328 per 1000 people) – nearly 76,000 more than the previous year and almost 300,000 more than in 2020-21.
Most (37%) were to public acute group A hospitals, and to principal referral and women’s and children’s hospitals (33%). And most (79%) took place between 8am and 10pm.
The proportion of people seen on time at public acute group A hospitals was (63%) – the lowest proportion – compared with 89% of patients at other hospitals, the highest.
All of the people requiring resuscitation received it immediately. But just 68% of those needing care within 10 minutes got it in that time, and 67% of all presentations were seen within the amount of time appropriate to their triage category – same as last year and not as many as in 2020-21 (71%).
Related


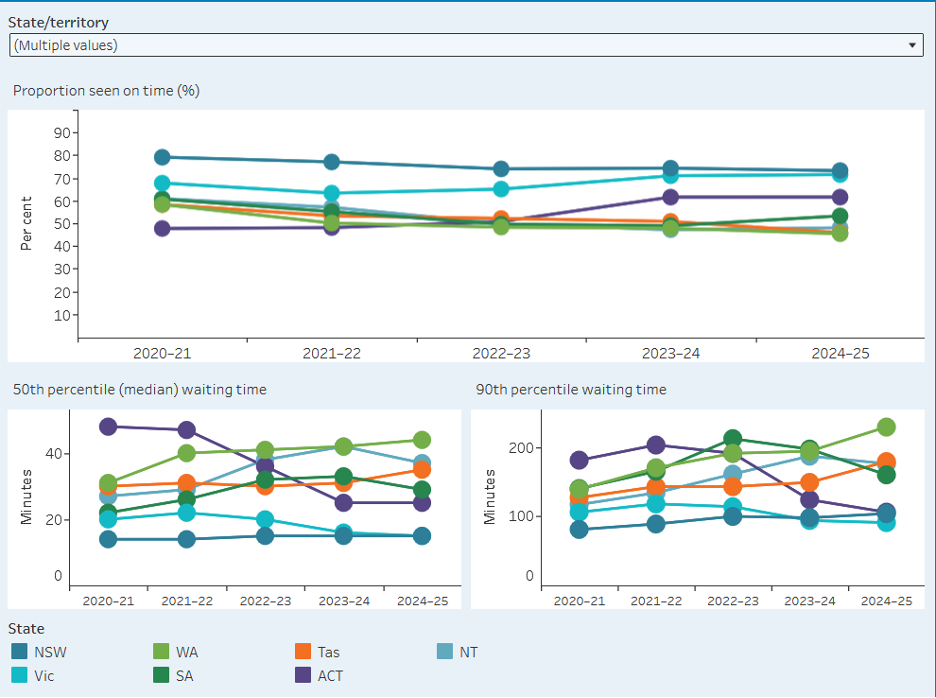
These are national figures, but the AIHW data breakdown shows that, unless you need resuscitation, the amount of time you’ll spend waiting in an emergency department varies across jurisdictions.
For example, the percentage of emergency patients (the next step down from resuscitation) seen on time (in 10 minutes) was 76% in NSW, 64% in Victoria, 73% in Qld, 67% in WA, 50% in South Australia, 47% in Tasmania, 64% in the ACT and 49% in the NT. And the next triage category, urgent (30 minutes), ranged from 69% in Victoria to 29% in WA.
NSW patients had the highest chance of being seen on time (73% were in 2024-25) and Western Australians the lowest (46%).
The gender split in ED presentations was about equal over all (51% female), but under-15s were more often men (56% of presentations) and over 15s were more often women (55% of 15-44-year-olds and 56% of those aged 85 and over).
Older people, 85 and over, were most often in emergency (915 presentations per 1000 population for males, and 782 per 1000 population for females) followed by under-five-year-olds (646 per 1000 population for males and 535 per 1000 population for females).
However, 45% of emergency department presentations were for people aged 25-64.
Nearly one in 10 presentations (9.3%) were for First Nations people (903 per 1000 population compared with 335 for non-Indigenous people).
Big-city people accounted for 61% presentations to EDs, compared to 3.6% in remote areas. But the rate of presentations for people in remote areas was higher – 664 per 1000 people and 686 per 1000 people in very remote areas compared to 281 for those in major cities.
There was direct correlation between likelihood of presenting at ED and socioeconomic advantage. Twenty-four percent of emergency department presentations were people in the lowest socio-economic areas and (428 per 1000 population, most likely). Meanwhile, people from the most advantaged areas only accounted for 13% of presentations (221 per 1000 population, least likely).