
The AIHW report cards didn’t deliver much good news on both fronts. See how the states and territories stacked up.
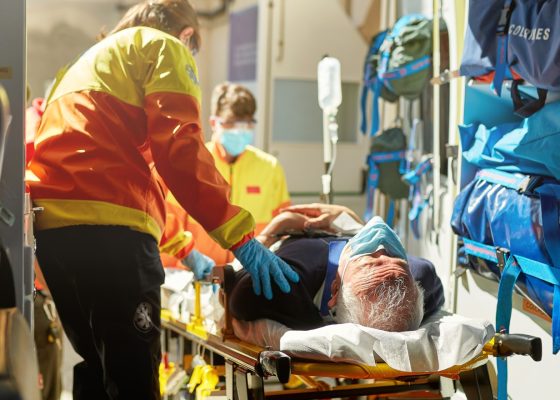
There wasn’t much good news for Australian hospitals today when it came to emergency department waiting times and elective surgery waiting lists.
The Australian Institute of Health and Welfare today released its report on ED care for 2022-23, and a report on elective surgery for 2022-23.
The ED report showed there were 8.8 million presentations for the period, a small rise on the previous year (8.79 million).
Just 65% of patients were seen on time for their urgency category, down from 67% in 2021–22. In 2022-23 100% of patients requiring resuscitation were seen on time by triage category. Wait data for other categories included:
- 64% of patients were seen on time in the emergency category.
- 58% of patients were seen on time in the urgent category.
- 68% of patients were seen on time in the semi-urgent category.
- 88% of patients were seen on time in the non-urgent category.
The report revealed that over time, the national trend has been for people to wait longer in the ED before being seen by a health professional. In 2022–23:
- 50% of patients were seen within 20 minutes, consistent with the median waiting time for 2021–22 and longer than in the three years prior to that.
- 90% of patients were seen within two hours and four minutes. This was higher than the previous four years which varied from one hour, 32 minutes in 2019–20 to one hour, 57 minutes in 2021–22.
The overall time patients spent in EDs in 2022–23 included:
- 56% of ED visits were completed within four hours, down from 61% in 2021–22 and 70% in 2018–19.
- 90% of ED visits were completed within 10 hours and 32 minutes in 2022–23 which is an increase of three hours since 2018–19 when 90% of visits were completed within seven hours and 29 minutes.
- The time in which 90% of ED visits for patients subsequently admitted to the hospital has increased by over 6.5 hours in recent years (from 11 hours, 43 minutes in 2018–19 to 18 hours, 23 minutes in 2022–23).
Three in 10 (29%) patients seen in the emergency department were admitted to hospital for further care.
AIHW spokesperson Clara Jellie said that in the five years prior to the covid pandemic, presentations to public hospital emergency departments steadily increased by an average of 3.2% per year, however, in more recent years the numbers have fluctuated and increased at an annual average annual rate of 1.3% over the most recent five years.
Overall, in 2022–23, 17% of patients were in the most urgent categories (resuscitation and emergency), and 76% were categorised as urgent or semi-urgent.

The state and territory breakdown also provided detail about the number of presentations and how long patients waited for care.
- In NSW there were 3.1 million presentations to public hospitals in 2022-23, and of these 74% were seen on time.
- In Victoria there were 1.9 million presentations to public hospitals in 2022-23, and of these 65% were seen on time.
- In Queensland there were 1.7 million presentations to public hospitals in 2022-23, and of these 67% were seen on time.
- In Western Australia there were 994,000 presentations to public hospitals in 2022-23, and of these 48% were seen on time.
- In South Australia there were 599,000 presentations to public hospitals in 2022-23, and of these 50% were seen on time.
- In Tasmania there were 174,000 presentations to public hospitals in 2022-23, and of these 52% were seen on time.
- In the ACT there were 146,000 presentations to public hospitals in 2022-23, and of these 51% were seen on time.
- In the Northern Territory there were 182,000 presentations to public hospitals in 2022-23, and of these 50% were seen on time.
The report on elective surgery waiting lists didn’t have much better news.
The number of patients undergoing elective (non-emergency) surgery in Australia’s public hospitals increased by 18% from 2021–22 to 2022–23, but many patients were still facing long wait times, according to the AIHW data.
Elective surgery waiting times were at the highest level in 20 years during 2022–23 as public hospitals worked to catch up following pandemic-related delays that arose due to disruptions in the health system.
Information on public hospital elective surgery waiting times and emergency department care in 2022–23 with national, state and territory, local hospital network and hospital-specific data was released today on the AIHW’s MyHospitals platform.
“Nationally, there were 735,500 admissions to hospital from public elective surgery waiting lists in 2022–23, up from 623,000 admissions in 2021–22, but still lower than before the covid-19 pandemic [758,000 admissions in 2018–19],” said Ms Jellie.
“Public hospitals made concerted efforts during 2020–21 and 2022–23 to work through procedures earlier delayed when non-urgent surgeries were suspended.
“But because of these earlier delays, overall waiting times for people admitted for care have increased.”
The data shows that half (50%) of all patients admitted from a public elective surgery waiting list were admitted for their procedure within 49 days (up from 40 the previous year and similar to 48 days in 2020–21). The proportion of patients who waited longer than 365 days to be admitted was 9.6%, up from 2.1% pre-pandemic (2018–19).
While overall waiting times have increased, the majority of patients in the most urgent category (admission recommended within 30 days) continue to be seen on time. In 2022–23, one-third (33%) of all patients admitted for care from a public hospital elective surgery waiting list were assigned to the most urgent category.
When it came to the elective procedures, general surgery was the most common surgical specialty (20%), followed by urological surgery (15%). Cataract extraction was the most common selected intended (indicator) procedure (10%), followed by Cystoscopy (7.5%).
The greatest increases in median waiting times occurred for:
- Septoplasty (50 days increase) – from 315 days in 2021–22 to 365 days in 2022–23. This is 124 days more compared with 5 years ago in 2018–19.
- Myringoplasty/Tympanoplasty (24 days increase) – from 259 days in 2021–22 to 283 days in 2022–23. This is 83 days more compared with 5 years ago in 2018–19.
- Total hip replacement (23 days increase) – from 153 days in 2021–22 to 175 days in 2022–23. This is 56 days more compared with 5 years ago in 2018–19.
Of the 25 most common surgeries, curettage and evacuation of uterus had the shortest median waiting time (four days) followed by breast lump-excision and/or biopsy (17 days). Septoplasty had the longest median waiting time (365 days)
The median waiting time for Aboriginal and Torres Strait Islander (First Nations) people (56 days) was higher than for other Australians (49 days).
The report also gave insight into each Australian state and territory, including how many admissions had been made in 2022-23, how many of these were seen in the clinically recommended time and the average overdue wait times for patients still on waitlists as of 30 June.
In NSW in 2022-23 there were 225,749 elective surgery admissions. Of these 77% were admitted within the clinically recommended time frame, and the average overdue wait time for patients on wait lists (as of 30 June) was 114 days.
In Victoria in 2022-23 there were 190,867 elective surgery admissions. Of these 75% were admitted within the clinically recommended time frame, and the average overdue wait time for patients on wait lists (as of 30 June) was 260 days.
In Queensland in 2022-23 there were 140,977 elective surgery admissions. Of these 78% were admitted within the clinically recommended time frame, and the average overdue wait time for patients on wait lists (as of 30 June) was 97 days.
In Western Australia in 2022-23 there were 225,749 elective surgery admissions. Of these 76% were admitted within the clinically recommended time frame, and the average overdue wait time for patients on wait lists (as of 30 June) was 147 days.
In South Australia in 2022-23 there were 55,900 elective surgery admissions. Of these 74% were admitted within the clinically recommended time frame, and the average overdue wait time for patients on wait lists (as of 30 June) was 112 days.
In Tasmania in 2022-23 there were 21,364 elective surgery admissions. Of these 62% were admitted within the clinically recommended time frame, and the average overdue wait time for patients on wait lists (as of 30 June) was 253 days.
In the ACT in 2022-23 there were 12,640 elective surgery admissions. Of these 69% were admitted within the clinically recommended time frame, and the average overdue wait time for patients on wait lists (as of 30 June) was 144 days.
In the Northern Territory in 2022-23 there were 225,749 elective surgery admissions. Of these 68% were admitted within the clinically recommended time frame, and the average overdue wait time for patients on wait lists (as of 30 June) was 391 days.